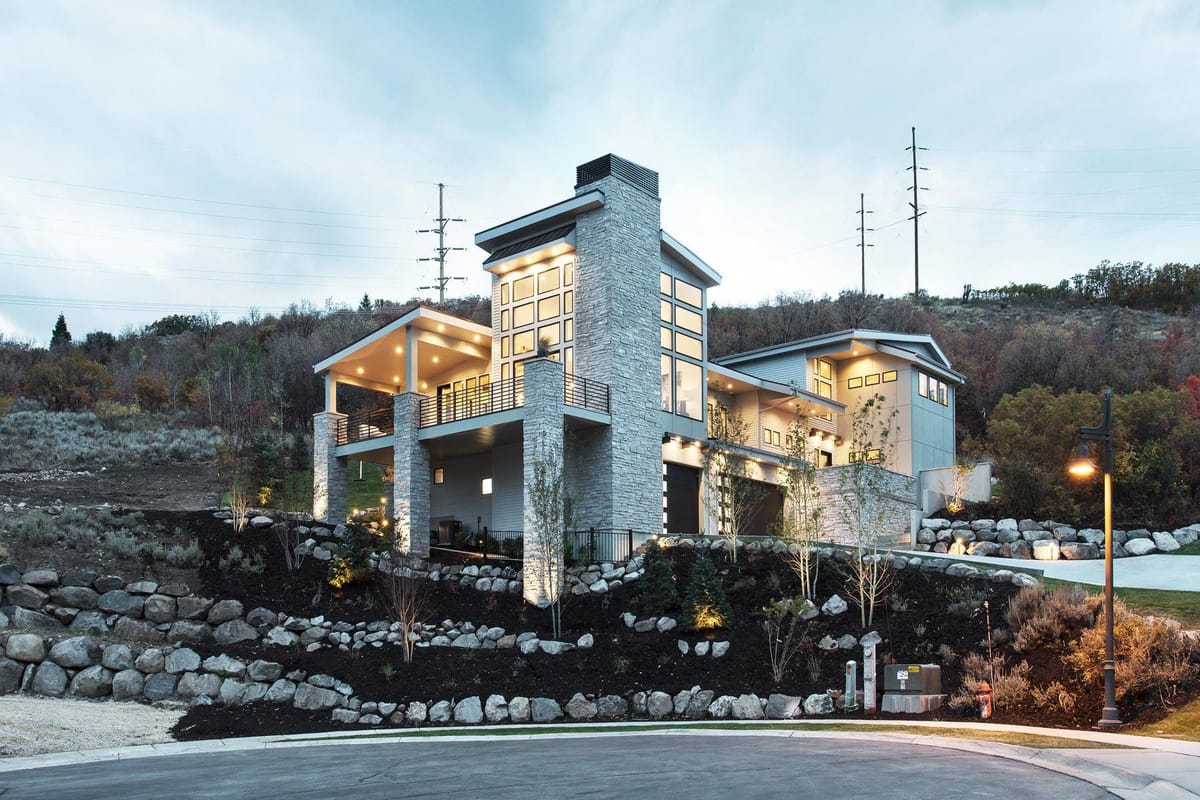
Heber, UT Metro Area Housing Market Analysis - January 2025
The Heber, UT metro area housing market is experiencing a dynamic start to 2025, characterized by significant shifts in pricing and sales activity. The Median Sales Price has surged to $1,575,000, marking a substantial year-over-year increase of 31.5%. This upward trend in sales prices indicates a strong demand for homes in the region, despite a contrasting decrease in the Median List Price, which has fallen by 7.7% to $1,750,000.
In terms of Price Per Square Foot, the market has seen a notable rise. The median Price Per Square Foot has increased by 14.5% year-over-year, reaching $638.07. Meanwhile, the Median List Price per square foot has experienced a modest increase of 2.5%, now standing at $753.73. These figures suggest that while sellers are adjusting their list prices, buyers are willing to pay more per square foot, reflecting a competitive market environment.
Sales activity in the Heber area shows a mixed picture. The number of Homes Sold has increased slightly by 1.4% year-over-year, totaling 140 homes. However, Pending Sales have decreased by 6.9%, with 188 transactions currently in the pipeline. This decline in Pending Sales could indicate a potential slowdown in future closings, despite the current uptick in completed sales.
New Listings have seen a healthy increase of 9.3% year-over-year, with 269 properties entering the market. Inventory levels have remained relatively stable, with a slight increase of 0.6%, totaling 945 homes. The Months of Supply remain unchanged at 6.8 months, suggesting a balanced market where neither buyers nor sellers have a distinct advantage.
The Median Days on Market have increased by 10% to 92 days, indicating that homes are taking longer to sell compared to the previous year. This extended time on the market could be attributed to the higher sales prices and the adjustments in list prices.
The average sale to list ratio has improved slightly by 0.7%, now at 97.6%, indicating that homes are selling closer to their list prices. However, the percentage of Homes Sold above list price has decreased by 1.6%, now at 11.4%. This decline suggests that while buyers are willing to pay near the asking price, fewer are engaging in bidding wars that push prices above the list.
Price Drops have increased slightly by 0.8%, with 18.6% of listings experiencing reductions. This trend may reflect sellers' attempts to align their pricing strategies with market conditions. Additionally, the percentage of homes going off the market within two weeks has risen by 4.2%, now at 18.1%, indicating that well-priced homes are still attracting quick interest from buyers.
Overall, the Heber, UT metro area housing market is navigating a complex landscape of rising sales prices and fluctuating sales activity. While demand remains strong, evidenced by the significant increase in Median Sales Prices, the market is also adjusting to changing buyer and seller dynamics, as seen in the varied trends in list prices, sales activity, and market timing.

Start the discussion
Become a member of Crib Metrics - Fresh Housing Market Insights and Analysis to start chatting with our AI Real Estate Market Analyst about the article Heber, UT Metro Area Housing Market Analysis - January 2025
Already a member?